This Map Shows You How Much COVID Is In Your Sewage Supply
There’s no better (or more gross) map for the real spread in your community.

As scientists continue their research on COVID-19, new discoveries are being made well beyond rapid tests and vaccines. Recently, there’s been focus on sewage. Yes, yuck, but it turns out all that poop gives an interesting picture about COVID-19 and can predict an increase of cases before traditional testing can.
According to Mashable, the Centers for Disease Control and Prevention (CDC) announced the launch of a new COVID-19 data portal which includes wastewater surveillance. Yes, they’re tracking poop because it has some interesting data about the spread of COVID-19. If a person has COVID-19, the virus’s RNA shows up in that person’s poop, but not all the time. The CDC explained this happens in 40-80 percent of people infected with COVID.
The interesting part of this is that the “shedding” of the RNA can happen before someone starts to show symptoms of COVID-19 prompting them to go and get tested. This means monitoring wastewater can be a good way to forecast the trends of COVID in a particular population before positive cases actually uptick.
The CDC has been tracking this data since the beginning of the pandemic, but it has expanded the effort, now calling it the National Wastewater Surveillance System (NWSS), to more areas of the country. And all the data is available to see if you’re curious.
Centers for Disease Control and Prevention
“What started as a grassroots effort by academic researchers and wastewater utilities has quickly become a nationwide surveillance system with more than 34,000 samples collected representing approximately 53 million Americans,” Dr. Amy Kirby, the NWSS program lead, said in a press briefing Thursday.
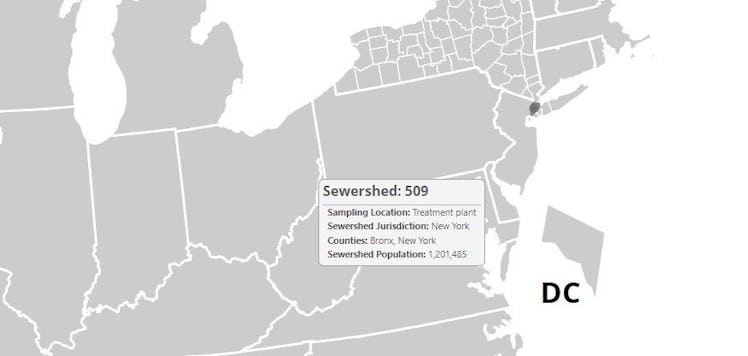
“On the map, you can zoom in to municipalities all over the country to see how their COVID levels in poo are changing,” Mashable reports. “The bluer an area’s dot, the more COVID is decreasing. A red dot means that area’s sewage is more COVID-y.” You can play around to see exactly what’s happening with the poop in your city here.
So, there you have it. It’s surprising. It’s gross. But … cool data?