October Rent Map Report Shows Where Rent Is Finally Dropping Nationwide
Following months of increased rental costs, a two-month trend is finally showing that things are slowing down--in most states.

Rent prices — and the cost of housing in general — has been one of the more persistent pains of the current inflation situation. But — although rents are still much higher today than they were a year ago — things are finally looking up (or down, depending on how you look at it.) Basically, new data shows that rent is finally dropping nationwide, month-over-month. However, there are still some metrics that need improvement. Here’s what you need to know.
Rent.com has been keeping very close tabs on rent prices across the country. For months, the data showed little signs that rental costs would slow. However, following the August data, Rent.com shared that there have been some promising signs on the rent cost front, and they have more good news from October’s data.
“The rental market continued to trend downwards in October, dropping nearly a percentage point month over month after dipping 2.5 percent from August to September,” Rent.com explains in its monthly report.
“While national rents in October were up 7.8 percent year over year, it's still lower than the 8.8 percent increase in September,” Rent.com adds.
The numbers analyzed by Rent.com also show that the median national rent costs dipped below the $2,000 mark for the first time in six months. In August 2022, the median national rent peaked at $2,053.
“Nationwide, October rent prices are down month over month, a two-month trend that provides further evidence the market is stabilizing,” Rent.com states.
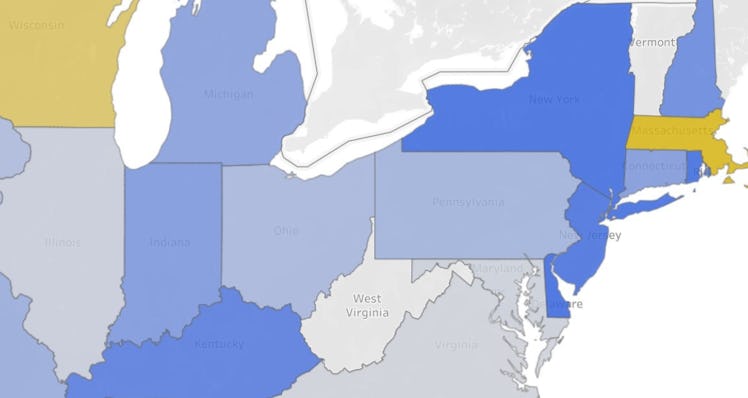
However, the median decline isn’t the same for every state. For example, Florida year-over-year rents saw a rise by 23.2%. However, housing experts who spoke with Rent.com attributed the price remaining high to natural disasters driving further shortages and supply chain issues in construction. South Dakota and New York are also still above the year-over-year rents, at 21.42% and 18.56%, respectively.
And while the month-over-month rates are trending in the right direction, Rent.com points out that most are still higher when looking year-over-year. Only Idaho, Wisconsin, Massachusetts, and Nevada showed year-over-year rental price declines.
Rent.com dug into the numbers more deeply, looking at the increases and decreases in cities across the country.
The top five cities with the highest increases in rent costs year-over-year:
- Oklahoma City, OK (+31.7%)
- Raleigh-Cary, NC (+21.0%)
- Cincinnati, OH-KY-IN (+17.0%)
- Louisville-Jefferson County, KY-IN (+15.8%)
- Indianapolis-Carmel-Anderson, IN (+15.1%)
The top five cities with the largest decreases in rent costs year-over-year:
- Austin-Round Rock-Georgetown, TX (-8.70%)
- Atlanta-Sandy Springs-Alpharetta, GA (-4.45%)
- Columbus, OH (-3.63%)
- Boston-Cambridge-Newton, MA (-2.94%)
- Baltimore-Columbia-Towson, MD (-1.60%)
View the full interactive map that shows not just year over year rental prices but also month over month rent price at Rent.com.
This article was originally published on