Two Maps Show Where It’s Best To Rent Versus Buy Right Now
These maps visualize where you might want to consider renting — or buying — in today’s wonky housing market.

American families are struggling to make ends meet amid inflation rates that are still rising. One essential and painful price point hitting the wallets of families has been the cost of housing. For renters and homeowners, the rising cost of monthly payments has been astronomical. And making the situation more complicated is the shifts seen in both home-owned and rental markets.
Both markets have seen unpredicted changes over past few years. Homeowners markets that used to be quite affordable skyrocketed in price due to pandemic moves. In other places, it became cheaper to rent than buy due to rising mortgage rates — even if buying might be a better long-term investment. But long-term investments, though great, require a lot of cash on hand.
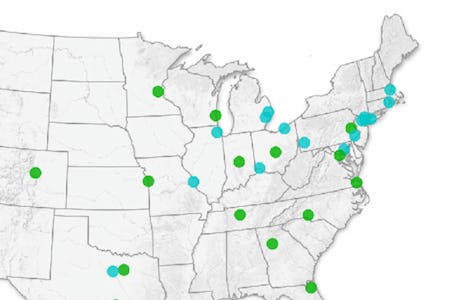
Fixr.com visualized whether it’s cheaper to buy a home or rent in various metros. The first step was collecting data from 50 metro areas Redfin chose and analyzed. Fixr found that in 22 out of 50 cities, it is now cheaper to rent rather than buy a house. From there, they took note of the monthly mortgage data according to the typical down payment number for the year (which was 5%).
“We then calculated the difference between typical monthly rental and mortgage payments and expressed this as a percentage to highlight where it is cheaper to rent a home and where it remains cheaper to buy,” Fixr explained. They then visualized where there was the biggest difference in cost between renting and buying and put those differences in these easy to-read maps.
Top 10 cities that became cheaper to rent than buy in
Fixr.com
- San Francisco, CA: 55.4% cheaper to rent than buy
- San Jose, CA: 54.8% cheaper to rent than buy
- Anaheim, CA: 37.7% cheaper to rent than buy
- Oakland, CA: 31.2% cheaper to rent than buy
- Los Angeles, CA: 28.5% cheaper to rent than buy
- San Diego, CA: 26% cheaper to rent than buy
- Seattle, WA: 25.4% cheaper to rent than buy
- Las Vegas, NV: 23.3% cheaper to rent than buy
- San Antonio, TX: 19.6% cheaper cheaper to rent than buy
- Kansas City, MO: 18.4% cheaper to rent than buy
Top 10 cities that is cheaper to buy than rent in
Fixr.com
- New Brunswick, NJ: 37.6% cheaper to buy than rent
- Pittsburgh, PA: 33.8% cheaper to buy than rent
- Philadelphia, PA: 33.1% cheaper to buy than rent
- Detroit, MI: 31.9% cheaper to buy than rent
- Fort Lauderdale, FL: 28.7% cheaper to buy than rent
- Newark, NJ: 28.5% cheaper to buy than rent
- Chicago, IL: 26.8% cheaper to buy than rent
- West Palm, FL: 19.2% cheaper to buy than rent
- Cleveland, OH: 18.2% cheaper to buy than rent
- Nassau County, NY: 18.2% cheaper to buy than rent
One of the most striking points that the maps visualize is that in “[twenty two] out of the 50 metros chosen and analyzed by Redfin, it became cheaper to rent than buy in 2022” over 2021, per Fixr. These maps only name the top 10 cities that have the starkest differences between rent and buy-cost of housing, but green dots indicate other places in the United States where it became cheaper to do either/or on each map.
And this shift is no small thing: “This represents a fundamental shift in the market dynamics of those 22 metros, with companies in all related industries trying to guess and prepare for how that huge shift will affect their customers and suppliers.” Fixr says that it will need to watch the other 28 housing markets included in this analysis to see if any tidal wave shifts happen in those markets, too.
To see the interactive map that shows which cities flipped from being cheaper to buy to being cheaper to rent in from 2021 to 2022, check out Fixr.
Redfin and Fixr’s data should not be that much of a surprise: Realtor.com’s June 2022 rental report estimated that in 38 out of 50 of the largest metros in the United States, it was still cheaper to rent even amid skyrocketing rent prices. Despite rent hitting record highs nationwide, renting a home was still cheaper for three-quarters of the largest metros, according to the report.
Housing affordability will continue to be an issue — one S&P Global Ratings report, per MarketWatch, shows it will soon take 11.3 years of saving income to afford a down payment for a starter home. The report also warns that in three years, 60% of households will price out completely from being able to buy a home.
This article was originally published on