This Map Shows Why You Might Be Struggling To Get A Vaccine Where You Live
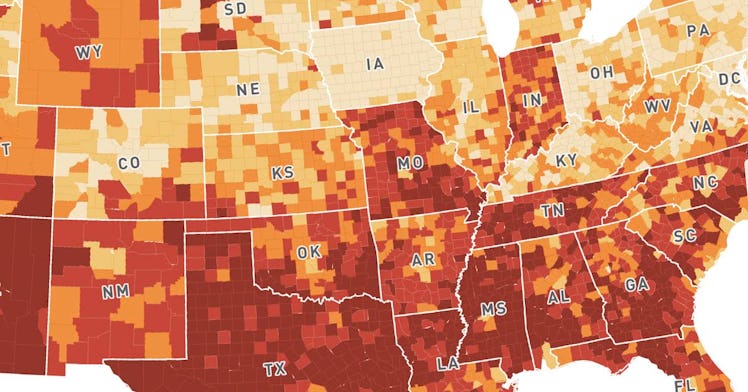
Are you struggling to get a COVID-19 vaccine where you live? This map might reveal why your vaccination drive is going so slowly.

After a rocky start, the rollout of COVID-19 vaccines has picked up. But that doesn’t mean that we’re doing very well at it, either, a new map reveals.
The new map from Surgo Ventures compiles data from a number of barriers that are already slowing vaccine rates in counties across the United States. The map captures “28 supply and demand” factors involved with vaccine roll-out, mainly through the themes of historic under vaccination, sociodemographic barriers, resource-constrained healthcare systems, and irregular care-seeking behavior. The results of the map? Most likely, the poorest, and most at-risk counties of the United States to COVID-19, will be the ones that struggle to get vaccinated the most.
In short, the map is an indictment of the health care system. But it could also be a very helpful tool in helping local governments create solutions to vaccine problems. The map very clearly shows that the biggest regions of concern for the equitable and timely distribution of COVID-19 vaccines are in the South and West, whereas the North East and Northern areas of the country seem to struggle less with vaccine distribution.
While the map isn’t necessarily an actionable tool for regular citizens — it is genuinely probably a better tool for government health officials — it may help you get a sense of why it’s taking so long for you or your loved ones to get a vaccine or become eligible for one. For example, in Dallas County, Texas, irregular healthcare-seeking behavior, health care accessibility barriers, and a resource-constrained health care system are the main reasons why the vaccine roll-out is so slow (but not the only reasons.) In Pinal County, Arizona, irregular care-seeking behavior is the main reason that people haven’t gotten the vaccine — as well as historic under vaccination and a resource-constrained health care system. Accessibility barriers and sociodemographic barriers play less of a factor. The reasons vary by county and may be a great tool for states to figure out what resources need to be poured into areas in order to drive up vaccination rates.
Surgo Ventures/mapbox
There is good news, however. From the continued production of the two-shot Pfizer and Moderna vaccines to the recent FDA authorization and CDC approval of the one-shot Johnson & Johnson vaccine, things are looking up. But they appear to still be moving at a snail’s pace. According to Fast Company, at the current rate of vaccination, it will take until February of 2022 for 90% of Americans to be vaccinated (we need at least 60 to 70 percent of people vaccinated in order to approach herd immunity.)
Still, the single-shot vaccine approval, ramped up production, and the upcoming $1.9 trillion COVID-19 stimulus package touted by President Joe Biden, which will give billions in the way of vaccine production, distribution, and health care worker training, could dramatically change the output of the vaccines, and increase equitable distribution to under-resourced counties.
Check out the interactive map here.
This article was originally published on